Room No: 20, Spik Building, Chelavur (Near Markaz Juma Masjid), Medical College, Kozhikode, Kerala, India-673008
THEIL’S INDEX
1. Introduction
Theil’s Index — A measure of economic inequality provides, ideally, a number summarizing the dispersion of the distribution of income among individuals. Such a measure is an indication of the level of inequality of a society. Building on this intuition, most discussions of inequality indicators depart from an individual-level analysis. When the distribution of income is equal, each person has the same share of the overall available income, and the measure of inequality assumes its absolute minimum.
Deviations from this equal distribution of income, when one or more individuals have a higher share than others, are captured by an increase in the level of the inequality measure.
Econometrician Henri Theil, at the Erasmus University Rotterdam in 1967, proposed the Theil’s Index.
It is a statistic used to measure economic inequality. It is a measure of inequality with unique properties that makes it a powerful instrument to produce data and to analyze patterns and dynamics of inequality.
It can be viewed as a measure of redundancy, lack of diversity, isolation, segregation, inequality, non-randomness, and compressibility.
It has also been used to measure the lack of racial diversity.
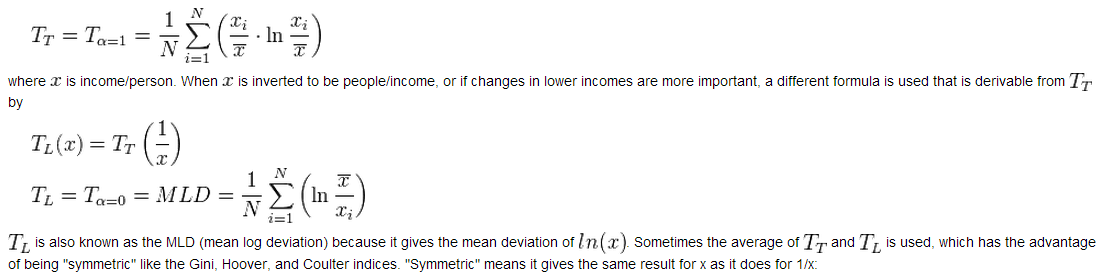
The basic Theil index is:
Basic Assumptions
When the distribution of income is equal, each person has the same share of the overall available income, and the measure of inequality assumes its absolute minimum.
This type of individual-level discussion of inequality provides a good intuitive framework for understanding some measures of inequality.
It has the advantage of being additive across different subgroups or regions in the country.
Theil index, which will simultaneously suggest a new intuitive interpretation and a more direct presentation of its many advantages vis-à-vis other inequality measures.
To do so, instead of departing from an individual-level analysis it is assumed that individuals are grouped.
Thus we will be looking primarily at inequality between groups of individuals, and not at inequality between individuals. The criterion for grouping is irrelevant here.
Examples include: geographic units, race, ethnicity, sex, education level, urban vs. rural population, or even income intervals.
If we take geographic units, for instance, we could be doing so because we were interested in variations in the distribution of income across countries.
Examples
Let us suppose we were interested in a measure of world inequality indicating the global variation in the distribution of income.
Let us consider a simple division between rich and poor countries for 1970. We first rank the 108 countries according the their level of GDP per capita, and place the first half in the “rich countries” group, and the second half in the “poor countries” group.
An equal distribution of income between the two groups requires the comparison of the population share with the income share of each group.
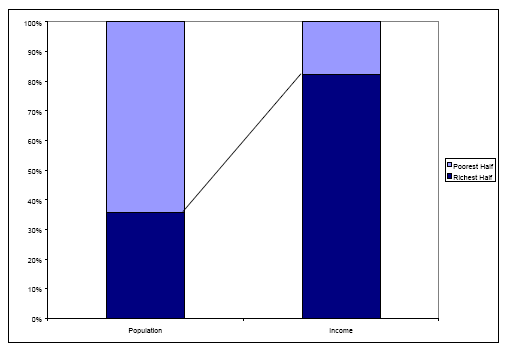
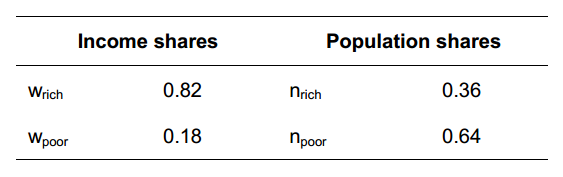
Figure 1 – World Inequality: Population and Incomes Shares of the 54 Richest and 54 Poorest Countries in the World in 1970
The richest 54 countries (richest half) have about 36% of the world’s population, while the countries included in the poorest group account for the remaining 64%. The rich countries have 82% of the world’s income.
In 1970 there was a large inequality in the distribution of income between these two groups. The “fair share” of income for the rich countries – that is, the income share in an equal world – should be 36% (equal to the population share), but it was in fact more than two times as large.
The representation in Figure 1 provides a graphic illustration of the inequality in 1970 between the two groups of countries. To summarize textually the inequality expressed in Figure 1 we can say that 36% of the world’s population lived in 1970 in countries that had 82% of the world’s available income.
But neither the graphic representation nor the textual description, compelling as they may be, provide us with a measure of inequality.
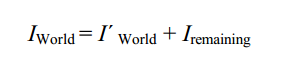
To clarify what we are looking for, some symbolic representation helps. As we said above, total inequality (inequality among all individuals in the world: IWorld) is composed of the inequality between the groups we are considering (I´World) plus the remaining inequality that is not accounted for by the between group inequality:
Intuitively, a measure for I´ should give us an indication of the discrepancy between the population share and the income share of each group. Let us call the income shares wrich and wpoor and the population shares nrich and npoor.
Income and population shares for the richest and poorest countries in the world
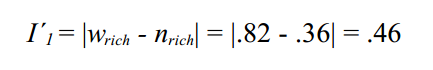
If we are interested in getting to a measure of inequality, how can we summarize the discrepancy between wrich and nrich in a single number? One easy way is to compute the absolute value of the difference:
Income and population shares for the richest and poorest countries in the world in 1970.
Discrepancy between wrich and nrich in a single number: I´1 = |wrich – nrich| = |.82 – .36| = .46
However, taking only one group ignores valuable information on the distribution of income between other groups. Hence, I´2, which sums the absolute values of the differences between income and population shares for every group: I´2 = |wrich – nrich| + |wpoor – npoor| = |.82- .36| + |.18 – .64| = .46 + .46 = .92
One way to achieve the goal of differentiating the groups is to multiply each difference by the share of income of the group it refers to. The measure where each difference is weighted by the income share is: I´ = wpoor x | wpoor – npoor | + wrich x | wrich – nrich |
If we take the absolute value of the sum of the differences between the ratio of the shares and one (to guarantee that the measure remains positive), we obtain a third measure of inequality: I´3 = |(1 – wrich / nrich) + (1 – wpoor / npoor)| = .58 Also same as, I´3 = |(1 / nrich) (nrich – wrich) + (1 / npoor) (npoor – wpoor)|
If we want to devise a measure of inequality based on the ratio of the shares that yields zero when the group shares are equal, a stronger transformation, and less intuitive a priority, is to apply a logarithmic transformation before each ratio: T´ = wrich.[log (wrich / nrich)] + wpoor.[log (wpoor / npoor)] = .46 Also same as, T´ = wrich.[log (wrich) – log (nrich)] + wpoor.[log (wpoor) – log (npoor)]
Ar. Ahammed Aflah E
Have A Business Idea In Your Mind?
Ready to start designing your dream space? Get in touch with D&A Architects, to discuss your vision and let our expertise bring it to life.